Review
Similar Products
|
R&D Systems
anti spib sheep polyclonal antibody  Anti Spib Sheep Polyclonal Antibody, supplied by R&D Systems, used in various techniques. Bioz Stars score: 93/100, based on 1 PubMed citations. ZERO BIAS - scores, article reviews, protocol conditions and more https://www.bioz.com/product/AF7204/Mouse+Spi-B+Antibody/pmc10641807-65-17-21 Average 93 stars, based on 1 article reviews
anti spib sheep polyclonal antibody - by Bioz Stars,
2026-10
93/100 stars
|
Buy from Supplier |
|
R&D Systems
sheep anti spib antibody Sheep Anti Spib Antibody, supplied by R&D Systems, used in various techniques. Bioz Stars score: 93/100, based on 1 PubMed citations. ZERO BIAS - scores, article reviews, protocol conditions and more https://www.bioz.com/product/AF7204/Mouse+Spi-B+Antibody/pm36625255-229-3-6 Average 93 stars, based on 1 article reviews
sheep anti spib antibody - by Bioz Stars,
2026-10
93/100 stars
|
Buy from Supplier |
|
R&D Systems
sheep anti mouse spi b polyclonal ab Sheep Anti Mouse Spi B Polyclonal Ab, supplied by R&D Systems, used in various techniques. Bioz Stars score: 93/100, based on 1 PubMed citations. ZERO BIAS - scores, article reviews, protocol conditions and more https://www.bioz.com/product/AF7204/Mouse+Spi-B+Antibody/pmc08687451-64-14-19 Average 93 stars, based on 1 article reviews
sheep anti mouse spi b polyclonal ab - by Bioz Stars,
2026-10
93/100 stars
|
Buy from Supplier |
|
R&D Systems
sheep antimouse spi b polyclonal ab Sheep Antimouse Spi B Polyclonal Ab, supplied by R&D Systems, used in various techniques. Bioz Stars score: 93/100, based on 1 PubMed citations. ZERO BIAS - scores, article reviews, protocol conditions and more https://www.bioz.com/product/AF7204/Mouse+Spi-B+Antibody/pmc07251786__mmc1-65-19-24 Average 93 stars, based on 1 article reviews
sheep antimouse spi b polyclonal ab - by Bioz Stars,
2026-10
93/100 stars
|
Buy from Supplier |
|
R&D Systems
anti tnfaip2 antibody  Anti Tnfaip2 Antibody, supplied by R&D Systems, used in various techniques. Bioz Stars score: 93/100, based on 1 PubMed citations. ZERO BIAS - scores, article reviews, protocol conditions and more https://www.bioz.com/product/AF7204/Mouse+Spi-B+Antibody/pmc06957684-328-23-33 Average 93 stars, based on 1 article reviews
anti tnfaip2 antibody - by Bioz Stars,
2026-10
93/100 stars
|
Buy from Supplier |
|
R&D Systems
anti spib antibody Anti Spib Antibody, supplied by R&D Systems, used in various techniques. Bioz Stars score: 93/100, based on 1 PubMed citations. ZERO BIAS - scores, article reviews, protocol conditions and more https://www.bioz.com/product/AF7204/Mouse+Spi-B+Antibody/pmc06957684-328-30-33 Average 93 stars, based on 1 article reviews
anti spib antibody - by Bioz Stars,
2026-10
93/100 stars
|
Buy from Supplier |
|
R&D Systems
triton x 100 pbs 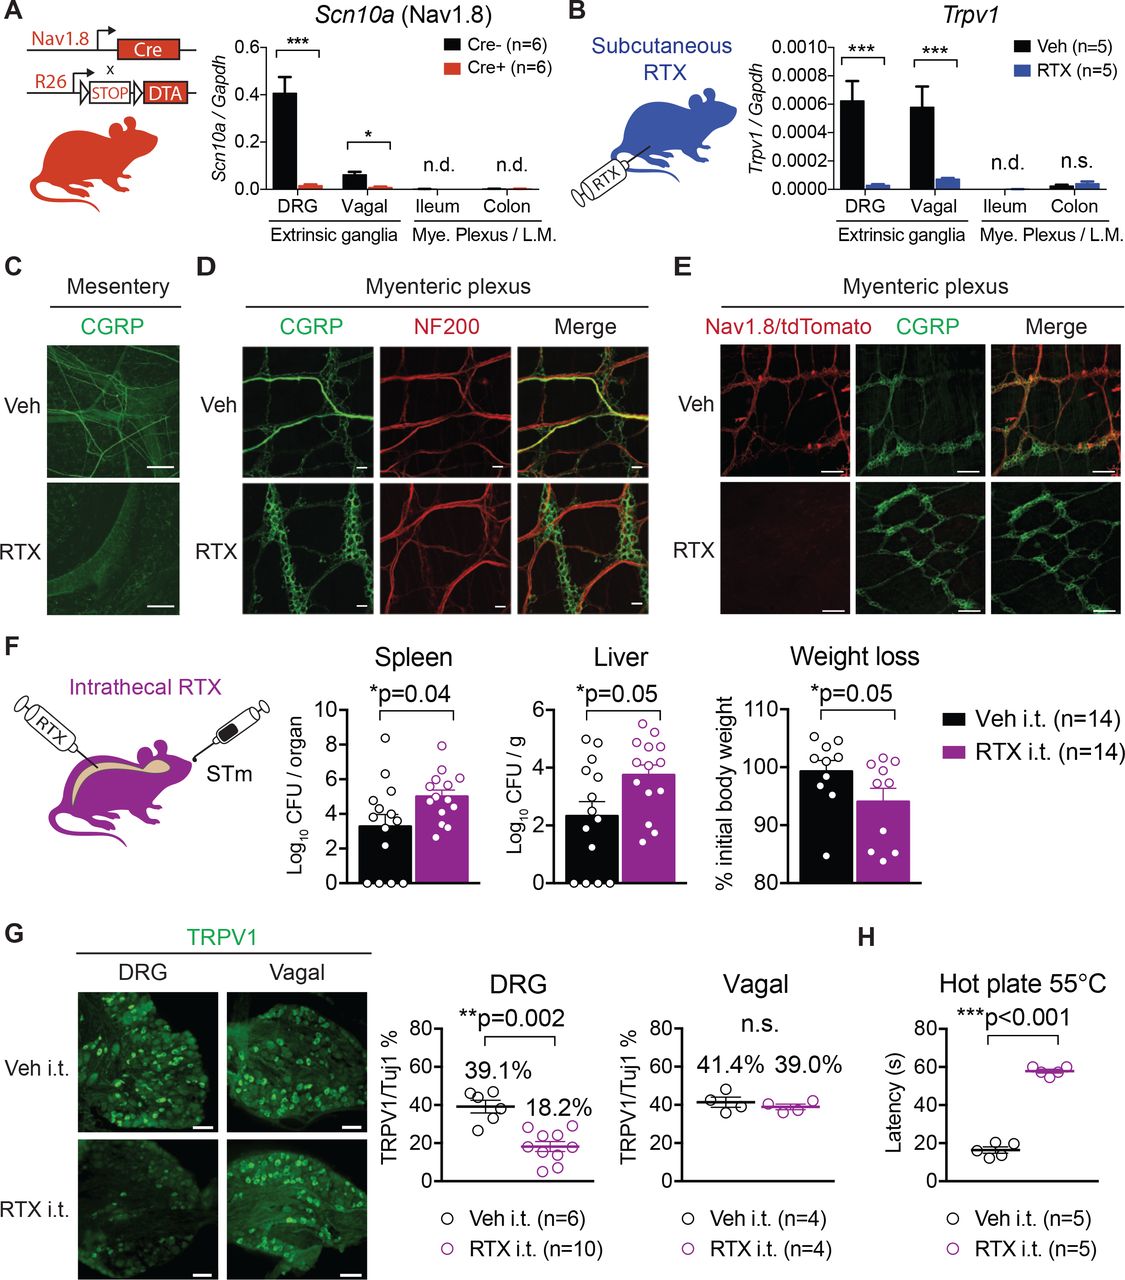 Triton X 100 Pbs, supplied by R&D Systems, used in various techniques. Bioz Stars score: 93/100, based on 1 PubMed citations. ZERO BIAS - scores, article reviews, protocol conditions and more https://www.bioz.com/product/AF7204/Mouse+Spi-B+Antibody/bio_rxiv__580555-376-28-38 Average 93 stars, based on 1 article reviews
triton x 100 pbs - by Bioz Stars,
2026-10
93/100 stars
|
Buy from Supplier |
Image Search Results
Journal: Frontiers in Immunology
Article Title: SpiB regulates the expression of B-cell-related genes and increases the longevity of memory B cells
doi: 10.3389/fimmu.2023.1250719
Figure Lengend Snippet: SpiB is expressed in GC B and B mem cells and induced by CD40 stimulation in vitro. (A) SpiB mRNA expression in B cell subsets from mouse spleen collected 14 days post NP-CGG immunization. B cells were sorted as CD19 + Igκ - and NP + CD38 + GL7 - (early B mem cells), NP + CD38 - GL7 + (GC B cells), or CD19 + CD21 lo CD23 hi AA4.1 - [naive follicular B (FoB) cells]. Comparison of early B mem and GC B cells (top) and naïve FoB and GC B cells (bottom) are shown. (B) SpiB mRNA expression in B cells cultured on 40LB feeder cells for 0-3 days (left) and B cells stimulated with the indicated antibodies or LPS (right). (C) Immunofluorescence microscopy of frozen sections of spleens from mice immunized with NP-SRBC 7 days previously. The sections were stained for SpiB (blue), IgD (red), and Thy1.2 (green) (top), or for SpiB (blue) and B220 (red) (bottom). (D) SpiB mRNA expression in sorted IgG1 + and IgE + from iGB cells cultured with IL-4 (iGB-4) for 4 days and IL-21 (iGB-21) for the following 4 days. (E) FCM analysis of the expression of CD138 and CD38 in SpiB high (blue) and SpiB low (red) iGB-4 and iGB-21 cells. SpiB staining profile and gating of iGB-4 and iGB-21 cells are shown on the left and the expression of CD138 and CD38 on the gated fractions are on the right. **p < 0.01, ***p < 0.001, ****p < 0.0001.
Article Snippet: Intracellular SpiB staining was performed with FoxP3 Staining Buffer Set according to the manufacturer’s protocol (eBioscience) with
Techniques: In Vitro, Expressing, Comparison, Cell Culture, Immunofluorescence, Microscopy, Staining

Journal: Frontiers in Immunology
Article Title: SpiB regulates the expression of B-cell-related genes and increases the longevity of memory B cells
doi: 10.3389/fimmu.2023.1250719
Figure Lengend Snippet: SpiB suppresses PC differentiation and Blimp1 expression while upregulates Bach2 expression in vitro. (A) Experimental protocol for retroviral overexpression and knockdown of SpiB in iGB cells. Spleen B cells were cultured on 40LB feeder cells with IL-4 for 5 days (IGB-4), to which the overexpression or knockdown retroviral vectors were introduced on day 2, then followed by the culture with IL-21 for 3- 5 days (iGB-21). (B) FCM analysis of CD138 and IgE expression on SpiB-overexpressing (left) or SpiB-knockdown (right) IGB-4 and iGB-21 cells. (C) FCM analysis of Blimp1-GFP expression in SpiB-overexpressing (left) or SpiB-knockdown (right) IGB-4 and iGB-21 cells. IgE + , IgM + and IgE - IgM - (mostly IgG1 + ) populations were gated on iGB-4 and iGB-21 cells (top panels) and the expression of GFP in each population (bottom) were analyzed by FCM (bottom). (D, E) qRT-PCR analysis of mRNA expression of B cell-related genes in SpiB-overexpressng (D) and SpiB-knockdown (E) Blimp1-KO iGB-4 cells. *p < 0.05, **p < 0.01, ****p < 0.0001.
Article Snippet: Intracellular SpiB staining was performed with FoxP3 Staining Buffer Set according to the manufacturer’s protocol (eBioscience) with
Techniques: Expressing, In Vitro, Retroviral, Over Expression, Knockdown, Cell Culture, Quantitative RT-PCR

Journal: Frontiers in Immunology
Article Title: SpiB regulates the expression of B-cell-related genes and increases the longevity of memory B cells
doi: 10.3389/fimmu.2023.1250719
Figure Lengend Snippet: SpiB is critical for B mem cell generation from iGB cells in vivo. (A) Experimental protocol for the generation of iMB cells from gene-transduced iGB-4 cells. iGB-4 cells derived from Ly5.1 congenic C57BL/6 (B6) mice were transduced with retroviral vectors expressing SpiB or shSpiB, or empty vectors as a control (cont.). These iGB-4 cells on day 5 were adaptively transferred to irradiated Ly5.2 congenic B6 mice. Spleen cells were analyzed 4 weeks later (for SpiB overexpression) or 2 weeks later (for SpiB knockdown) by FCM. (B, C) Frequencies of CD19 + Ly5.1 + iMB cells in the spleens of the recipient mice. A representative FCM data (left) and the frequencies among lymphocytes (right) [ (B) : n = 6; (C) : n = 3]. *p < 0.05.
Article Snippet: Intracellular SpiB staining was performed with FoxP3 Staining Buffer Set according to the manufacturer’s protocol (eBioscience) with
Techniques: In Vivo, Derivative Assay, Transduction, Retroviral, Expressing, Control, Irradiation, Over Expression, Knockdown

Journal: Frontiers in Immunology
Article Title: SpiB regulates the expression of B-cell-related genes and increases the longevity of memory B cells
doi: 10.3389/fimmu.2023.1250719
Figure Lengend Snippet: Long-lived B mem cells and memory antibody response are defective in SpiB cKO mice. (A) Frequencies of CD19 + Ly5.1 + (total iMB) cells and CD19 + Ly5.1 + IgG1 + iMB cells in the spleens of the recipient mice transferred with iGB-4 cells derived from SpiB WT or SpiB cKO mouse B cells 4 weeks earlier, analyzed by FCM. A representative FCM data (left) and the frequencies among lymphocytes (right) (N =3). (B) A protocol of a mice immunization experiment. SpiB WT and SpiB cKO mice were intraperitoneally immunized with NP-CGG in alum and boosted with NP-GCC without alum to induce memory response at 66 days after the primary immunization. Spleen cells and blood were collected before immunization and at the indicated timepoints (spleen) and as indicated in (D) (blood). (C) Frequencies of NP + IgG1 + or NP + IgG1 - , total B, B mem and GC B cells in the spleens at the indicated time points after NP-CGG immunization in SpiB WT or SpiB cKO mice. Spleen cells were gated on B220 + Igκ low , NP + IgG1 + or NP + IgG1 - cells before gating on B mem (GL7 - CD38 + ) or GC B (GL7 + CD38 - ) cells. A representative FCM data (left) and the frequencies among lymphocytes of three to six mice (right) are shown. (D) Concentrations of serum antibodies of total anti-NP-IgG1 (left) and high-affinity anti-NP-IgG1 (right) from SpiB WT or SpiB cKO mice primarily immunized with NP-CGG in alum and secondarily with NP-CGG alone on day 66. (n = 4) *p < 0.05, **p < 0.01.
Article Snippet: Intracellular SpiB staining was performed with FoxP3 Staining Buffer Set according to the manufacturer’s protocol (eBioscience) with
Techniques: Derivative Assay

Journal: Frontiers in Immunology
Article Title: SpiB regulates the expression of B-cell-related genes and increases the longevity of memory B cells
doi: 10.3389/fimmu.2023.1250719
Figure Lengend Snippet: SpiB suppresses PC differentiation independently of Bach2. (A) Expression of intracellular SpiB and cell-surface CD138 in SpiB WT, Blimp1-KO, Bach2-KO and Blimp1/Bach2 DKO iGB-4 cells analyzed by FCM. (B) mRNA expression of SpiB , Bach2 , and Prdm1 in SpiB WT and SpiB cKO iGB-4 cells analyzed by qRT-PCR. (C) FCM analysis of CD138 expression on Bach2-KO iGB-4 (left) and iGB-21 (right) cells transduced with mock-, Bach2-, SpiB-expressing retroviral vectors. (D) qRT-PCR analysis for mRNA expression of SpiB , Bach2 , and Prdm1 in IgG1 + GC B and B mem cells from spleens of SpiB WT and SpiB cKO mice immunized with NP-CGG in alum 14 days earlier. *p < 0.05, **p < 0.01, ***p < 0.001, ****p < 0.0001.
Article Snippet: Intracellular SpiB staining was performed with FoxP3 Staining Buffer Set according to the manufacturer’s protocol (eBioscience) with
Techniques: Expressing, Quantitative RT-PCR, Transduction, Retroviral

Journal: Frontiers in Immunology
Article Title: SpiB regulates the expression of B-cell-related genes and increases the longevity of memory B cells
doi: 10.3389/fimmu.2023.1250719
Figure Lengend Snippet: SpiB-deficient GC B and B mem cells express lower levels of anti-apoptotic and autophagy genes and are more prone to die. (A, B) qRT-PCR analysis for mRNA expression of indicated anti-apoptotic genes (left) and autophagy genes (right) in IgG1 + GC B cells (A) and IgG1 + B mem cells (B) from spleens of SpiB WT and SpiB cKO mice immunized with NP-CGG in alum 14 days earlier. (C) FCM analysis for MitoSOX staining of the same cells as in (A, B) Cells were incubated for 0 or 9 hours in non-FCS medium before staining. Representative FCM data (left) and the frequencies of MitoSOX-positive cells (n = 3 or 4) (right). (D) FCM analysis for the expression of LC3B in the same cells as in (A, B) Representative FCM data (top) and mean fluorescence intensity (MFI) of the LC3B stained cells (bottom) are shown (n = 5). (E) Frequencies of dead cells in NP + IgG1 + CD38 + B mem cells from spleens of SpiB WT and SpiB cKO mice immunized with NP-CGG in alum 14 days earlier. Percentages of the dead cells detected microscopically following Trypan Blue staining after 9 hours’ culture in non-FCS medium as compared to those before the culture (n = 5). *p < 0.05, **p < 0.01, ***p < 0.001, ****p < 0.0001.
Article Snippet: Intracellular SpiB staining was performed with FoxP3 Staining Buffer Set according to the manufacturer’s protocol (eBioscience) with
Techniques: Quantitative RT-PCR, Expressing, Staining, Incubation, Fluorescence
Journal: Nature Communications
Article Title: Osteoprotegerin-dependent M cell self-regulation balances gut infection and immunity
doi: 10.1038/s41467-019-13883-y
Figure Lengend Snippet: a Enrichment analysis based on KEGG functional hierarchy for gene expression in M cells relative to their expression in enterocytes. Node size indicates the false-discovery rate of the parametric enrichment analysis. Red and blue nodes indicate respective significantly upregulated and downregulated pathways in M cells. b Gene expression profiles of enterocytes and M cells are shown. The heat map colors represent logFC for expression levels of genes compared with the mean expression value of each gene in enterocytes. c Increased expression of Tnfrsf11b ( Opg ) in the FAE of Peyer’s patches, relative to expression in villus epithelium (VE). Results are normalized to Gapdh expression and are presented relative to the expression in the mean of VE. Values are presented as the mean ± standard error. *** p < 0.005 (Student’s t -test, n = 4 animals). d Stereomicroscopic image of a whole-mount specimen of FAE monolayer and associated crypts, which was separated from the follicle by manipulation after treatment with EDTA as described in the Methods. The FAE area was surrounded by 12 crypts, as indicated by arrows. Scale bar: 200 µm. e OPG (red) is expressed in Tnfaip2 (blue)-positive and GP2 (green)-positive M cells in the FAE. Scale bars: 50 µm. f OPG (green) is expressed in Spi-B (red)-positive M cells of a FAE-associated crypt. The lower panel is an enlarged view of the area within the square in the upper panel. Cell nuclei were stained with DAPI (blue, left panel). F-actin was stained with phalloidin (gray, right panel). DIC differential interference contrast image. Scale bars: upper panel, 20 µm; lower panel, 10 µm. g Opg is an early expressing gene in the ileal epithelium after RANKL administration. Results were normalized to Gapdh expression and are presented relative to the expression in the epithelium without GST-RANKL treatment (time 0). Values are presented as the mean ± standard error. All data are representative of two ( c ) or three independent experiments ( a , b , d , e – g ). The source data underlying panels c and g are provided as a Source Data file.
Article Snippet: The primary antibodies used for immunofluorescence staining are as follows: anti-OPG antibody (catalog number AF549; R&D systems, 1:400); anti-GP2 antibody (D278-3; MBL, 1:400);
Techniques: Functional Assay, Gene Expression, Expressing, Staining

Journal: Nature Communications
Article Title: Osteoprotegerin-dependent M cell self-regulation balances gut infection and immunity
doi: 10.1038/s41467-019-13883-y
Figure Lengend Snippet: a The numbers of M cells labeled with Tnfaip2 (green) and GP2 (red) are prominently increased in the follicle-associated epithelium (FAE) of Payer’s patches from Opg −/− mice. Each indicated channel is shown separately in gray scale. Scale bars: 200 µm. b The numbers of Tnfaip2-positive or GP2-positive M cells in the FAE of Peyer’s patches from WT and Opg −/− mice were quantified. Values are presented as the mean ± standard deviation. *** p < 0.005 (Student’s t -test, n = 4 of WT and 9 of Opg −/− mice). c The expression levels of M cell-associated genes in the FAE of Peyer’s patches were normalized to Gapdh expression and are presented relative to the expression in the villus epithelium (VE). Values are presented as the mean ± standard deviation. ** p < 0.01, *** p < 0.005 (Student’s t -test, n = 4 animals). d Whole-mount staining images of GP2 (red), Spi-B (green), and DAPI (blue) in cecal FAE. Scale bars: 100 µm. e The numbers of Tnfaip2-positive or GP2-positive M cells in the FAE of cecal patches from WT and Opg −/− mice were quantified. Values are presented as the mean ± standard deviation. * p < 0.05 (Student’s t-test, n = 4 of WT and 9 of Opg −/− mice). f The uptake of latex beads into Peyer’s patches and cecal patches was measured. Data from three independent experiments are presented as the mean ± standard deviation. *** p < 0.005. n.s. not significant (Student’s t -test, n = 7 animals). The source data underlying panels b , c , e and f are provided as a Source Data file.
Article Snippet: The primary antibodies used for immunofluorescence staining are as follows: anti-OPG antibody (catalog number AF549; R&D systems, 1:400); anti-GP2 antibody (D278-3; MBL, 1:400);
Techniques: Labeling, Standard Deviation, Expressing, Staining
Journal: bioRxiv
Article Title: Gut-innervating nociceptor neurons protect against enteric infection by modulating the microbiota and Peyer’s patch microfold cells
doi: 10.1101/580555
Figure Lengend Snippet: (A) qRT-PCR of Scn10a transcripts (encoding Nav1.8) from DRG, vagal ganglia, ileum, and colon myenteric plexus/longitudinal muscle tissues of Nav1.8-Cre/DTA mice and control littermates (n=6 mice/group). (B) qRT-PCR of Trpv1 transcripts from DRG, vagal ganglia, ileum and colon tissues of vehicle-treated and RTX-treated mice (n=5 mice/group). (C) The mesentery was immunostained for the neuropeptide CGRP in vehicle and RTX-treated mice. The mesentery contains afferent and efferent nerve fibers to the gastrointestinal tract, Scale bar, 100 um. (D) Myenteric plexus was stained for CGRP and neurofilament 200 (marker for large diameter A-fibers). RTX-treated mice exhibited a loss of thick CGRP nerve tracts carrying extrinsic fibers to the myenteric plexus. Within the myenteric plexus, CGRP+ intrinsic enteric neurons remained intact. Scale bar, 25 um. (E) Nav1.8-Cre/tdTomato mice treated with RTX exhibited a loss of tdTomato+ extrinsic sensory fibers compared to vehicle-treated mice, while CGRP+ intrinsic enteric neurons remained intact in the myenteric plexus. Scale bar, 100 um. (F) Wildtype mice injected intrathecally with RTX or vehicle were orally infected with STm and sacrificed at 5 dpi to examine STm dissemination and weight loss. Data are pooled from 3 experiments with an infection dose of 1.2-1.8 × 10 7 CFU from vehicle (n=14) and RTX (n=14) intrathecally injected mice. (G) Quantification of the proportions of TRPV1+ neurons out of total Tuj1+ neurons in lumbar DRGs and vagal ganglia of intrathecally injected mice. Data are from vehicle (n=3) and RTX (n=3) intrathecally injected mice. Scale bar, 50 um. (H) Hot plate latency for vehicle and RTX intrathecally injected mice (n=5 mice/group). Statistical analysis: (A-B) Two–way ANOVA and Sidak post-tests for qRT-PCR. (F) Mann-Whitney tests for CFU analysis. Unpaired t-test for weight loss analysis. (G, H) Unpaired t-tests for DRG and vagal ganglia immunostaining analysis, and hot plate analysis. *p<0.05, **p<0.01, ***p<0.001. Error bars are mean ± SEM. See also Figure S2.
Article Snippet: Tissues were blocked in 10% normal goat serum or donkey serum/0.25% Triton X-100/PBS for 2-4 hr at 4°C, then incubated overnight at 4°C in primary antibodies in 0.1%
Techniques: Quantitative RT-PCR, Staining, Marker, Injection, Infection, MANN-WHITNEY, Immunostaining

Journal: bioRxiv
Article Title: Gut-innervating nociceptor neurons protect against enteric infection by modulating the microbiota and Peyer’s patch microfold cells
doi: 10.1101/580555
Figure Lengend Snippet: (A) Whole-mount image of Peyer’s patch (PP) follicle associated epithelium (FAE) stained for Tuj1+ nerve fibers and glycoprotein 2 (GP2+) M cells. Scale bar inset, 25um. (B) Nav1.8-Cre/DTA mice and control littermates were infected with 0.8 × 10 7 CFU of wildtype STm or 0.9 × 10 7 CFU mutant Δ FimH STm and sacrificed at 1 dpi to analyze STm tissue burden. Data are pooled from 3 experiments with Cre-mice infected with WT STm (n=9), Cre-infected with Δ FimH STm (n=5), Cre+ mice infected with WT STm (n=9), and Cre+ infected with Δ FimH STm (n=7). (C) Quantification of GP2 density in ileal PP FAE from uninfected Nav1.8-Cre/DTA , Trpv1-DTR , and subcutaneous RTX-treated mice. Data are represented as GP2 density per follicle (left), or GP2 density of 3-6 follicles averaged per mouse (right). Data are pooled from 2 experiments of Nav1.8-Cre/DTA mice (n=6 Cre- and n=7 Cre+), Trpv1-DTR mice (n=4 vehicle and n=4 DTX), and RTX-treated mice (n=8 vehicle and n=8 RTX). Scale bar, 100um. (D) Quantification of SpiB density in ileal PP FAE from uninfected subcutaneous RTX-treated mice. Data from vehicle (n=4) and RTX (n=4) mice. Scale bar, 100um. Statistical analysis: (B) Non-parametric one-way ANOVA and Dunn’s post-tests for CFU analysis. (C-D) Unpaired t-tests for GP2 and SpiB analysis. *p<0.05, **p<0.01, ***p<0.001. Error bars are mean ± SEM. See also Figure S5 and S6.
Article Snippet: Tissues were blocked in 10% normal goat serum or donkey serum/0.25% Triton X-100/PBS for 2-4 hr at 4°C, then incubated overnight at 4°C in primary antibodies in 0.1%
Techniques: Staining, Infection, Mutagenesis

Journal: bioRxiv
Article Title: Gut-innervating nociceptor neurons protect against enteric infection by modulating the microbiota and Peyer’s patch microfold cells
doi: 10.1101/580555
Figure Lengend Snippet: (A) M cells were depleted in vehicle and RTX-treated mice by injections of anti-RANKL or IgG isotype control (250ug/mouse i.p. every 2 days starting 5 days prior to STm oral infection). Quantification of GP2 density in ileal PP FAE from 2 experiments of uninfected vehicle+IgG (n=6), RTX+IgG (n=6), vehicle+anti-RANKL (n=5), and RTX+anti-RANKL (n=5) treated mice. Data are represented as GP2 density per follicle (left), or GP2 density of 3-6 follicles averaged per mouse (right). Scale bar, 100um. (B) Following 5 days of pre-treatment with anti-RANKL or IgG control, vehicle and RTX-treated mice were orally infected with 0.7-1.9 × 10 7 CFU STm, and sacrificed at 5 dpi to examine STm tissue burden and weight loss. Data are pooled from 3 experiments with vehicle+IgG (n=11), RTX+IgG (n=10), vehicle+anti-RANKL (n=12), and RTX+anti-RANKL (n=10) treated mice. (C) Villin-Cre +/− mice were crossed with RANK fl/fl mice to generate M-cell sufficient mice (RANK fl/fl ) or mice with conditional epithelial cell depletion of RANK that were depleted of M cells (RANK ΔIEC ). Mice were injected s.c. with RTX to deplete TRPV1+ neurons, then orally infected with 0.8 × 10 7 CFU STm. Quantification of GP2 density in ileal PP FAE from RANK fl/fl +Veh (n=3), RANK fl/fl +RTX (n=4), RANK ΔIEC +Veh (n=4), and RANK ΔIEC +RTX (n=3) treated mice at STM 5dpi. Data are represented as GP2 density per follicle (left), or GP2 density of 3-6 follicles averaged per mouse (right). Scale bar, 100um. (D) Vehicle and RTX-treated Villin-Cre;RANK fl/fl mice were sacrificed at 5 dpi to examine STm tissue burden and weight loss. Data are from RANK fl/fl +Veh (n=3), RANK fl/fl +RTX (n=4), RANK ΔIEC +Veh (n=4), and RANK ΔIEC +RTX (n=3) mice. Statistical analysis: (A,C) One-way ANOVA and Sidak post-tests for GP2 analysis. (B,D) Non-parametric one-way ANOVA and Dunn’s post-tests for CFU analysis. One-way ANOVA and Fisher’s post-test for weight loss analysis. *p<0.05, **p<0.01, ***p<0.001. Error bars are mean ± SEM. See also Figure S6.
Article Snippet: Tissues were blocked in 10% normal goat serum or donkey serum/0.25% Triton X-100/PBS for 2-4 hr at 4°C, then incubated overnight at 4°C in primary antibodies in 0.1%
Techniques: Infection, Injection

Journal: bioRxiv
Article Title: Gut-innervating nociceptor neurons protect against enteric infection by modulating the microbiota and Peyer’s patch microfold cells
doi: 10.1101/580555
Figure Lengend Snippet: (A) Representative calcium fields and traces of cultured DRG neurons stimulated with vehicle (Krebs-Ringer), STm (1 × 10 9 CFU/ml), capsaicin (1uM Cap) and KCl (40mM) (n=5 plates/condition). Scale bar, 30um. (B) CGRP released from cultured DRG neurons stimulated with live, heat-killed, and supernatant cultures of STm. Supernatant-induced CGRP release is blocked by addition of Botulinum toxin (BoNT/A) (n=4 samples/condition). (C) Quantification of GP2 density in ileal PP FAE of Calca +/+ and Calca −/− littermates. Data are represented as GP2 density per follicle (left), or GP2 density of 3-6 follicles averaged per mouse (right). Data are pooled from 2 experiments with uninfected Calca +/+ (n=9) and Calca −/− (n=9) mice, and from Calca +/+ (n=8) and Calca −/− (n=7) mice infected at STM 5dpi. Scale bar, 100um. (D) Calca +/+ (n=15) and Calca −/− (n=14) mice were orally infected with STm and sacrificed at 5 dpi to examine STm dissemination and weight loss. Data are pooled from 3 experiments with Calca +/+ (n=15) and Calca −/− (n=14) mice infected with 1.9-2.2 × 10 7 CFU STm. Statistical analysis: (B) One-way ANOVA and Sidak post-tests for CGRP release. (C) Unpaired t-tests for GP2 analysis. (D) Mann-Whitney tests for CFU analysis. Unpaired t-test for weight loss analysis. *p<0.05, **p<0.01, ***p<0.001. Error bars are mean ± SEM. See also Figure S7.
Article Snippet: Tissues were blocked in 10% normal goat serum or donkey serum/0.25% Triton X-100/PBS for 2-4 hr at 4°C, then incubated overnight at 4°C in primary antibodies in 0.1%
Techniques: Cell Culture, Infection, MANN-WHITNEY